Evaluating PGO training with WPA

After days, months, years of effort, your program is finally taking shape. Tears, sweat, and blood have been spilled wringing every last bit of performance out of the code, and now you're ready to hand it over to the compiler and profile guided optimization (PGO) to finish the task. You flip the magic switches, make the program jump through a few hoops, flip some more switches, and out pops an optimized build. Magic. But when you this supposed gift from the compiler gods, it doesn't seem to be any faster. In fact, on Tuesdays it even seems to run slower. What gives? Did you flip the right switches? Did you train it properly? Is PGO simply worthless? How can you even find out?
Enter VS 2013 and WPA
Using the sample profiler built into Windows, you can profile your application and make sure the hottest portions of code correspond to what your PGO training led the compiler to think were the hottest portions. This has always been possible to do manually with various command line tools, but Visual Studio 2013 and the Windows 8.1 version of WPA have teamed up to make this easy.
While Visual Studio 2013 seems pretty much identical to its 2012 edition, it has two very important improvements. The first is Peek Denfinition, and the other is something actually relevant to this discussion: the inclusion of PGO optimization decision data in the PDBs that it generates (notably absent in the MSDN DIA SDK reference but available in dia2.h nonetheless). PDBs hold all the information needed to debug your binary, and with VS2013 you can use them to debug your PGO training as well. In order to make VS2013 even more effective, Microsoft has also produced a new downloadable UI to make using PGO easier. If you can't use Visual Studio 2013 the rest of this post will be useless to you.
In addition to Visual Studio 2013, you will need the Windows 8.1 (or later) version of the Windows Performance Analyser. Luckily this ships with Visual Studio 2013, so there's nothing extra to install. This version introduces several PGO related columns in the "CPU Usage (Sampled)" table, as well as numerous bug fixes and speed-ups.
It's worth noting that the PGO information available in WPA is also more or less available within the Visual Studio profiler as well, but using that would pretty much defeat the entire purpose of this post.
PGO and You
PGO works by building a specially instrumented version of your program that records its general flow of execution. It then uses this information to decide how to best optimize your code. Code that is executed a lot is deemed hot, and is inlined, optimized for speed, and/or laid out together with other hot code in resulting optimized binary. Code that is barely run gets optimized for size and laid out with other cold bits of code at the tail end of the binary. All this occurs on the basic block level, so PGO is able to separate your functions into hot and cold chunks and optimize them differently.
Since PGO optimizations are all highly dependent on which blocks of code actually executed during the training, you want your training scenario to be as close as possible to how people in the real world will use your program. Unfortunately, PGO instrumented binaries are slow and it's not always possible to run comprehensive training scenarios, especially if you are trying to continuously tweak things. It's also possible to over-train PGO by spending too much time executing features that people in the real world will rarely use. If you force every line of code to be considered hot then you are doing no better than compiling the entire program for speed, a choice which can paradoxically make your program run slower. You want your training scenario to be as short as possible while still being representative of how users will use your program, and herein lies our problem: how can you tell if your training is accurate and effective?
Beginning
In order to evaluate your PGO training, you first need to actually build the PGO instrumented version of your code, run your training scenario on that build, and build another optimized version based on that training. MSDN has a set of articles on how to do this, and there is always Google, so you're on your own for this part.
- Profile-Guided Optimizations
- Walkthrough: Using Profile-Guided Optimizations
- Visual C++ Team Blog: Profile Guided Optimization (PGO)
One important thing to note is that PGO cannot operate on static libraries. If your code happens to be separated into various statically linked bits and pieces, you're just plain out of luck. Perhaps try the Intel compiler.
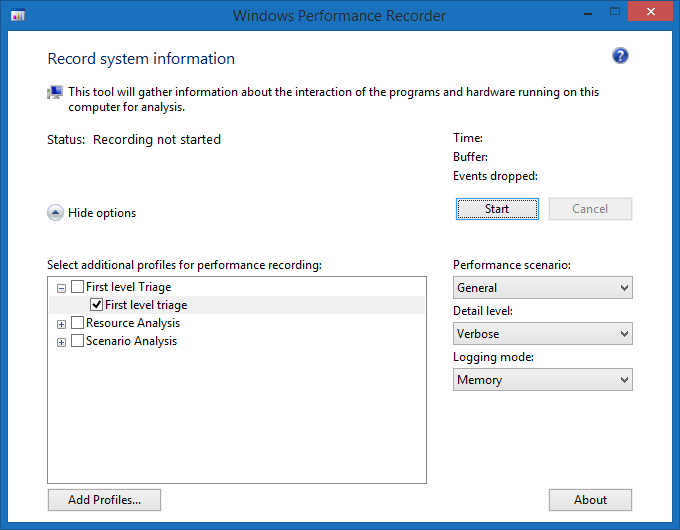
Once you have your optimized build, the next step is to run Windows Performance Recorder (WPR), part of the WPT. Enable the First Level Triage check-box and hit Start. Don't have a First Level Triage check-box? You must be running an old version; make sure to completely uninstall it before installing the new one if you want things to have a chance of working properly.
Once WPR starts recording, launch your program and run through some typical work loads. Since you are running an optimized build and since WPR has a very minimal overhead, you can afford to make this more extensive than your PGO training. There is still the lingering question of "is this work load representative of normal usage?", but now you can record multiple traces from different people and see how they compare to your training, or use the WPA Exporter to export each trace to CSV and write some code to aggregate and analyse them at scale. The possibilities are only limited by your ability to understand the exporter documentation.
Load Those Symbols
Once you have your trace open in WPA, you will need to turn on symbol loading to get at the PGO data (it's stored in the PDB, remember?). Once symbol loading is enabled, WPA will search for the symbols for every image referenced in the trace. Numerically this will be somewhere between "grab a cup of coffee" and "go out for a nice meal". In this case, however, only the symbols for your particular program matter, so you can tell WPA to ignore the rest by changing the symbols paths in the Configure Symbols dialog before hitting Load. Remove any path from the top text box that isn't related to your code, and ignore the second text box unless you want to change where WPA stores its compressed version of the PDBs.
"Kyle", I can hear you ask, "the symbol path in the dialog didn't point to the symbols for my program. How did WPA find them?" The answer is the full path to the PDB is embedded inside the corresponding executable when they are compiled, along with a signature. WPR, when it is recording the trace, copies these two bits of information into the trace itself. XPerf does the same when you use the "-d" parameter to stop the trace, or use the "-merge" option to perform the action on an already stopped trace. WPA then uses these bits of information to find the PDB, even if you are looking at the trace on a different computer. As long as the PDB is still located where the compiler put it, WPA will find it. If you recompile the program and then PDB changes, the signature will no longer match the one recorded in the trace file and WPA will refuse to show any symbols from it. If this is going to be an issue you should archive your PDBs by using SymSrv or make sure to load them with WPA at least once so the smaller .symcache file is created. Once this file exists WPA can load symbols from it without needing the original PDB, and it can do so much faster to boot.
Drilling In
Trace is open, symbols are loading in the background, and soothing music is whispering in your ears. It is now time to start actually doing some work. First, you will need to open the "CPU Usage (Sampled)" table. Find your process, select it, and click on it, and hit "Filter to Selection". Next, open the View Editor and start dragging the PGO columns from the left over to the center pane. Above the gold bar you will want to add the "Is PGO'ed" column, followed by "PGO Counts", and "Compiler Optimization". Make sure they are all checked. You can uncheck the process column since you have already filtered the table to just your process. After these columns add the "Module" and "Function" columns. Below the gold bar add the "PGO Dynamic Instruction Count" column. To save yourself time, click the "Manage" button in the bottom left hand corner, give this preset (column arrangement) a name, save it, hit OK in the View Editor window, and select "Export..." from the Profiles menu. Next time you open WPA you can apply this saved profile to restore this column arrangement.
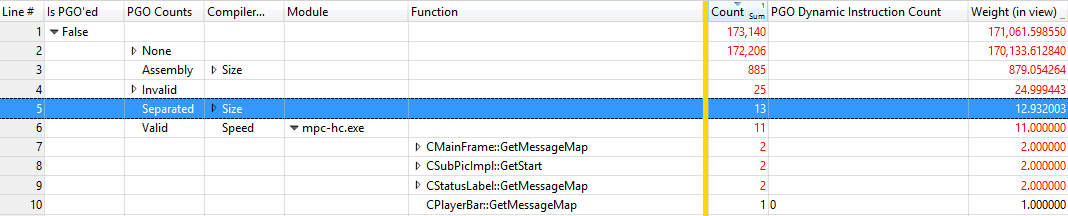
Before you start looking at the actual data in the table, a quick word on what these columns actually mean. Each row in the table corresponds to a single sample taken by the profiler. A sample consists of the address of the code running on one processor and the time of the sample. From there WPA maps this address to a function name and PGO information about the function. WPA assumes that this function executes for the entire time until the next sample (by default every 1ms).
- Is PGO'ed: True or False, depending on whether PGO has evaluated the function or not.
- PGO Counts: Whether the PGO training matches the compiled code, or other reasons why PGO has not evaluated the function. Possible values are:
- Valid: No problems, the PGO training is up-to-date or PGO was not enabled for this module at all.
- Invalid: The code for the module holding the current function has changed since the PGO training was last recorded, so no optimization decisions could be made. You should re-run run your training.
- Separated: The function has been broken into two pieces (hot and cold); this is the cold piece that has been separated from the hot path.
- Assembly: The function is written in assembly. PGO only works on C/C++.
- Compiler Optimization: Whether the function was optimized for size or speed. This column works independent of PGO.
- Module: The module the function is compiled in.
- Function: The name of the function that was running at the time that the sample profiler took the sample.
For a more general introduction to the other columns in this table, refer to Bruce Dawson's informal documentation The Lost XPerf Documentation - CPU Sampling.